Understanding the gap
A significant number of low-income students in the Cambridge School District fail basic math and literacy exams. Students also cluster in classes by race and ethnicity. While I am not an expert on how this plays out specifically in CPSD, I am trying to understand our root causes and to shift the dialog towards a more evidence-based approach.
Let's start with where are. The Cambridge Public School District has a 25-35% gap in performance between low-income and non-low income students. Similar gaps exist between white students and people of color. Test proficiency has steadily risen at 1-2% per year, while the gap has stayed roughly constant. If this growth were to continue at this rate, low-income students would reach 100% proficiency by 2040 or 2050:
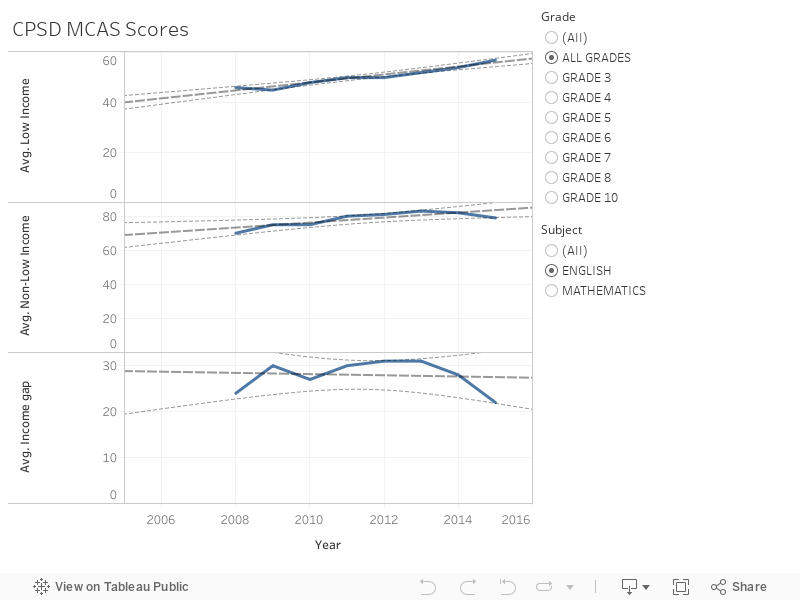
In the interactive plot, it is insightful to look grade-by-grade (please ignore the "all" button). The data contradicts the prevailing wisdom that the gap grows year-by-year over students' education. To the extent 3rd grade and 10th grade exams can be compared, the gap falls from a 30% difference in proficiency to a 10-15% difference over the course of seven years in CPSD. That's promising and suggests we're doing something right in the school system and that much of what we're mostly happens before third grade (and quite likely, before kids hit the schools system).
The CPSD administration defines diversity in terms of race, gender, socioeconomic status, LGBTQ, and occasionally, national origin (indeed, in many CPSD documents, “diversity” is used as shorthand for "percentage people of color"). Most efforts target groups based on statistical aggregate stereotypes of those groups. A refugee family from Myanmar would be in the same low-income Asian demographic as Harvard graduate students from Beijing University, while a recent immigrant from Ethiopia would be in the same demographic group as an African American who has lived in Cambridge for many generations. Given the demographics of the district, individuals I have spoken to believe the groupings are representative of a majority of students, but there is a shared concern that they misplace several significant minorities.
Starting with that set of assumptions, the district administration takes a few approaches:
- Integration efforts. All schools are balanced to within a few percent by socioeconomic status. This integration is achieved through a busing system which costs $8.4 million (5% of the school budget), or a lifetime total of around $20,000 per student. Despite high levels of socioeconomic integration between schools, students report strong in-school segregation
- Social justice. The CPSD byline is "Cambridge Public Schools are built on a foundation of academic excellence and committed to promoting an environment of social justice." Many classrooms have extensive discussions of social justice integrated into the curriculum
- Reducing perceived effects of disadvantages. For example, there are efforts to combat the effects of early childhood trauma in how discipline is handled in high school
- Recruiting teachers of color. The school district has a goal of 30%
- Differentiated instruction. We have moved away from tracked education to attempting to target all students in common classrooms
These efforts are slightly scattershot. Many root causes are missed (indeed, until we have universal pre-K, all of these efforts miss the critical 0-4 age range), and few are grounded in the science of learning or psychology. We also have no idea how effective these efforts are. For some efforts, we do not even know whether, as implemented, the effect is positive or negative.
Within schools, approaches differ quite a bit more, as do results. An apples-to-apples comparison may be misleading since school demographics differ in many ways other than just income, but regardless of how one looks at it, the obvious standout is Fletcher/Maynard Academy. FMA has no gap between low-income and non-low-income students, and the second-highest performance for low-income students in the district. Qualitatively, FMA school literature targets immigrants, students with disabilities and other typically underperforming communities. This is reflected in the school enrollment demographics -- the school has the highest percentage of high-needs students in the district -- 64.2%. The education policy community believes (based on what is in my opinion somewhat dated research) that problem students bring everyone down, while rich students improve overall school standards and culture, so researcher wisdom (folklore?) would hold that schools with FMA's demographics should significantly underperform for all students. Rather, FMA excels:

What does FMA do? A lot of things:
- Deep understanding of individual students and families.
- High expectations for every students (and bending over backwards to refuse to accept failure)
- Flexibility and responsiveness to individual students' needs and situations
- Deep community engagement
- Extended school day allowing for programs like music and language
- Early engagement through programs like BabyU and Scholar College
- Global cultural awareness and an inclusion model (as opposed to just racial awareness). Deep conversations built from a foundation of trust.
- Music and language programs
- School uniforms
- Teacher empowerment
We see even more variation between individual teachers and classrooms in how they approach these issues, but we have little hard data about what does and does not work.
What's next
Closing the gap before 2040 requires intentional, deliberate, rigorous, and methodological work. Specifically, I would propose a two-tiered approach.
First of all, we want to copy what works. FMA is unique in the district in closing the gap, and we should learn from it. We should also learn from similar efforts which have succeeded elsewhere. For mathematics, a model used in Los Altos where students spend time working through a self-paced digital mathematics curriculum, with extensive support, has shown tremendous promise for closing the achivement gap. Based in part on that success, a similar model based on iReady is used in many schools in California. High-support/high-expectations schools have closed the gap almost entirely through a model which relies on significant teacher support. Students at many poor schools in Asia and Eastern Europe also master mathematics more effectively than low-income students in CPSD. Because Asian and Eastern European contexts and problems differ from CPSD's, the models do not translate directly, but some key aspects do. In my experience working with other high needs populations worldwide, simply integrating successful best practices is often sufficient to close gaps.
Second of all, I would propose that we increase both the rate and the rigor of innovation of projects within CPSD by compiling:
- A list of hypothesized root causes of the gap in Cambridge;
- Best data on the likely effect sizes of those causes;
- A list of proposals to address those root causes; and
- The costs of implementing those proposals
From there, we could prioritize based on cost-and-effect. While this sounds intimidating, much information on benefit is readily available. There are even nice charts from metastudies showing effect sizes for many general educational interventions. For ones specifically targeting gaps, there aren't such nice visualizations, but the primary sources are pretty accessible. And, of course, much of what's out there is qualitative, especially when based on individual observations by Cambridge students, parents, and educators. That's okay too; lack of numbers doesn't mean something is less worth doing. But we do want to put such observations and ideas in a common framework so we can compare and prioritize rationally. Where possible, we want to try such approaches through bottom-up pilots rather than top-down district-wide changes.
To get this process going, in the coming months, I’ll post a series of strawman hypotheses, proposals, as well as a few ballpark numbers where available. These won't constitute a platform (the point of hypotheses is that many are incorrect), but rather, the start of a process; I don't have the solutions here, but based on my conversations, I believe the community does if we can provide proper channels. What I can do effectively is provide a framework for doing so, facilitate the process, and help tie back to research evidence and to related programs worldwide. If you have your own hypotheses, I'm glad to post them as well (please do let me know whether you'd like me to do that anonymously or with credit).